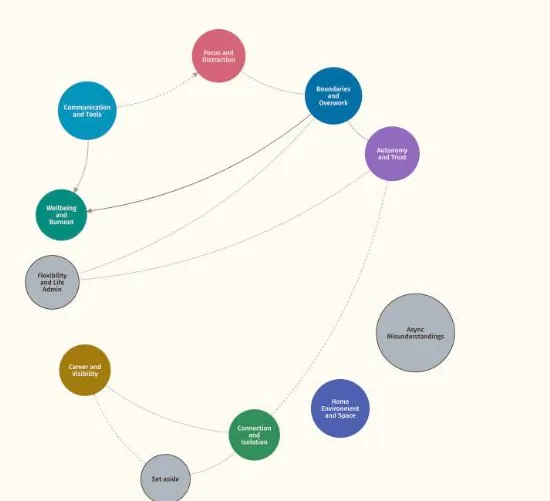
 Conference slideOpen →Working Well, all connectionsReflexive thematic analysis · Node network with connections16:9 slide, Present mode · Working Well sample dataset
Show relationships between themes
Draw the links you see between themes, codes and sub-codes, each marked as found in the data, proposed in theory, or cause and effect.
Used in phases 4 and 5, reviewing themes and defining themes
Theoretical
A dashed branch is a link you propose, with your note on why.
Three kinds of link, each with your reasoning
Thematic analysis is as much about how themes relate as about what each one holds. Show relationships lets you record those links on the map. Each link joins two themes, codes or sub-codes, carries a note saying why, and is drawn in one of three ways so a reader can tell evidence from interpretation.
You decide every link. Themescape draws what you record and suggests nothing.
- EmpiricalA shared codeA solid line joins two themes linked by a code or experience in the data.
- TheoreticalA link in theoryA dashed line marks an association you propose, with no code between them yet.
- CausalCause and effectAn arrow on either kind points to the effect, where you have identified cause and effect.
Recording a link
Links can be added in the viewer or in the Connections tab.
In the Connections tab
Each row has from, to, note, type and arrow. Type is evidenced or theoretical, and a blank type counts as evidenced. Arrow is to, from or blank, and an arrow always points at the effect.
Linking sub-codes
Write a sub-code as Code > Sub-code: the code name, a space, the > sign, a space, then the sub-code name.
Saved with your project
Links marked in the viewer are exported back to the Connections file when you save your progress.
In the other views
Connections show in every view while Show connections is on. In File tree they are drawn as arcs beside the rows, and in Hierarchy they are drawn for the theme, code or sub-code you select. New links are drawn with + Add branch, which is in Node network.
Related features
The features you will use alongside show relationships, closest first.
See your own themes come to life
Try the live demo or start a 7 day free trial. Your data is read in your browser and never leaves your computer.