What the figure shows
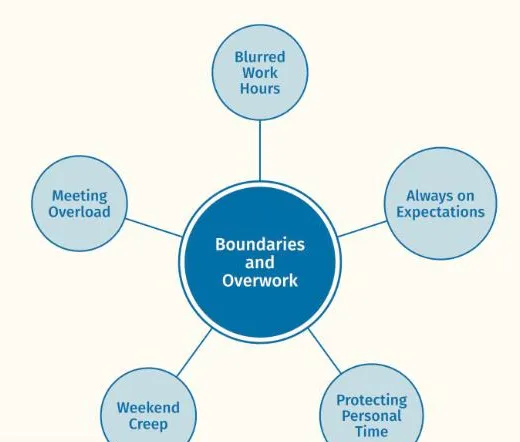
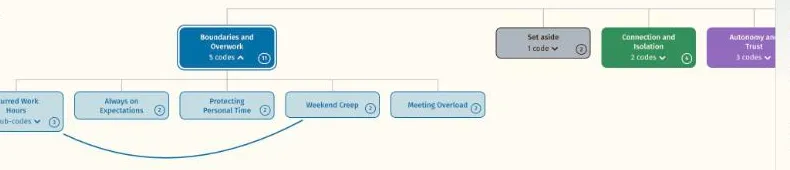
The whole Working Well sample on one slide: nine themes, 32 codes and the 15 connections recorded between codes. Most connections are Empirical, drawn as solid lines; three are Theoretical, drawn dashed, such as the link between Feeling out of the Loop and Being Trusted to Deliver. Three carry an arrow pointing to the effect, such as Video Call Fatigue leading to Exhaustion Signals.
Why this view
The node network is the only view that draws every connection, and on a slide the point is the overall shape: which themes are tied together and which stand apart. Up close, a talk can then open one theme at a time.
On the slide
In the talk the map is shown live in Present mode, where clicking a code brings its favourite quotes forward. The still on the slide is exported for the deck and handout. Figure export draws connections when they show on screen.