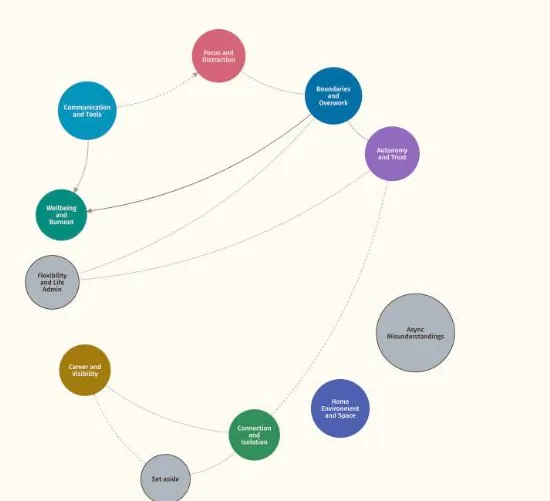
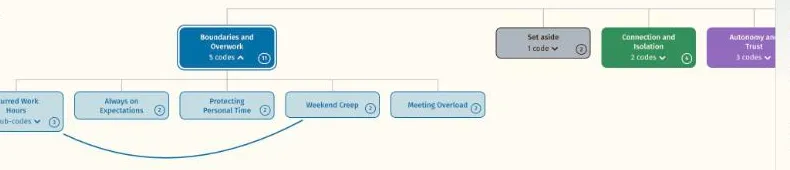
What the figure shows
One theme from the Working Well sample, Boundaries and Overwork, at the centre of its five codes: Blurred Work Hours, Always on Expectations, Protecting Personal Time, Weekend Creep and Meeting Overload. Each code is drawn in a lighter fill of the theme's colour, with its quotes as small dots around it. Eight of the twelve sample participants speak to the theme.
The theme's working definition reads: "How participants experience the loss of a clear edge between work and home, and the strategies they use to reinstate one." The figure shows both halves of that idea at once, the codes that describe the edge eroding and the one, Protecting Personal Time, that describes putting it back.
Why this view
The node network shows how a theme's codes gather around one central idea, which is what a reader needs before the chapter works through each code in turn. It makes the size of each code visible without turning it into a count, and it leaves room on the page for the caption to do its work.
In the thesis
A figure like this opens the section on the theme, before the first quote. The figure is made from made-up sample data, so it carries no participant names, and the caption names the software with an in text citation.