What the figure shows
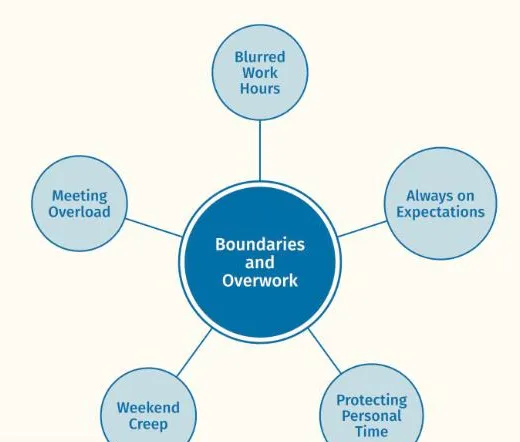
The same theme as the thesis figure, Boundaries and Overwork, laid out as a tree. The theme sits at the top, its five codes beneath it, and the code Blurred Work Hours branches again into two sub-codes, Morning Bleed and Evening Bleed. Each level is drawn in a lighter fill of the theme's colour.
Why this view
A journal column is narrow and tall, and a hierarchy reads top to bottom, so it fits where a network would need shrinking. It also shows nesting at a glance: a reader can see straight away that Blurred Work Hours is the one code with sub-codes, which the article then explains.
In the article
A figure like this sits beside the paragraph that introduces the theme, so readers can hold the structure in mind while they read the quotes. The figure is made from made-up sample data and carries no participant names.