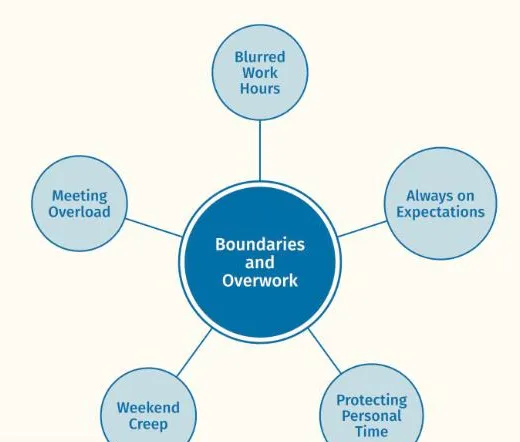
 ThesisOpen →Boundaries and OverworkReflexive thematic analysis · Node network, one themeA findings chapter, full text width · Working Well sample dataset
See your themes as a node network
Every theme, code and quote drawn as a connected map, so the shape of your analysis is visible at a glance.
Used in phases 3, 4 and 5, generating themes and reviewing themes and defining themes
Arrange it yourself
Custom placement lets you move themes and codes to where they make sense to you.
One map of everything you have coded
The node network draws your coding as a map. Each theme is a solid circle in its own colour, its codes sit around it in a lighter fill of the same colour, and each quote is a small silver dot. Branches join each code to its theme and each quote to its code, so you can see at once which themes are large, which are thin and where codes cluster.
Colour belongs to the theme. Everything beneath a theme keeps that theme's colour, and only the size and the depth of the fill change from code to sub-code, so the eye can follow one theme across a busy map.
- ThemeA solid circle in the theme's colour, with its name inside
- Code and sub-codeA lighter fill of the theme's colour with an outline, smaller at each level
- QuoteA silver dot; the quote itself appears in the reader when you select it
- BranchA fine line running edge to edge between a node and the one it belongs to
Reading the network
Start with the whole map, then follow one theme at a time.
Custom placement
The network lays itself out to start with. Custom placement lets you drag themes and codes into an arrangement of your own, for example grouping themes that you plan to discuss together. The arrangement is kept in the layout file when you save your progress.
Up to eight theme colours
The first eight themes take the eight default colours in order. A ninth theme and beyond are drawn in silver with an outline, and a project with many themes is often clearer split into views. You can set your own colours in the Framework tab.
Connections
Links you record between themes, codes and sub-codes are drawn on the network as solid, dashed or arrowed branches. See Show relationships.
When the network suits
It is the view for seeing the whole analysis at once, for spotting a theme that is doing too much or too little, and for a figure that shows how the parts relate.
Related features
The features you will use alongside node network, closest first.
See your own themes come to life
Try the live demo or start a 7 day free trial. Your data is read in your browser and never leaves your computer.